
Note: Paul Dicomo was a great friend to eCoustics and many of us over the past 2 decades. Sadly, Paul lost a courageous battle with cancer in 2021 and the industry lost a brilliant man who taught a generation of audio/video journalists how to understand the products that we cover.
Paul contributed a number of excellent articles over the years and we hope that a new generation of readers finds great value in his writing.

By Paul Dicomo
The Secret Behind The Industry’s Most-Cited Spec.
Here’s a quick quiz: which of these two speakers sounds better: Speaker A with a frequency response range of 45Hz to 18kHz or, Speaker B with a range of 20Hz to 25kHz? The truth is there’s simply not enough data in these numbers to know anything of value. Taken out of context and without other data, a simple set of numbers don’t tell you much about real world sound quality. But people make audio buying decisions based on published specifications, such as the frequency response spec, everyday. I’d like to demystify the process for you; let you in on a little industry secret about “The Frequency Response Spec.”
My Frequency Response
The Frequency Response specification attempts to describe the range of frequencies or musical tones a speaker can reproduce, measured in Hertz (known to old-timers as “Cycles per Second”). The range of human hearing is generally regarded as being from 20Hz, very low bass tones, through 20kHz (20,000Hz), the very highest treble. Presumably a speaker that could reproduce that range would sound lifelike. Alas, it is no guarantee. The most important determinant of a speaker’s frequency performance is not its width or range, but whether it’s capable of reproducing all the audible frequencies at the same volume at which they were recorded.
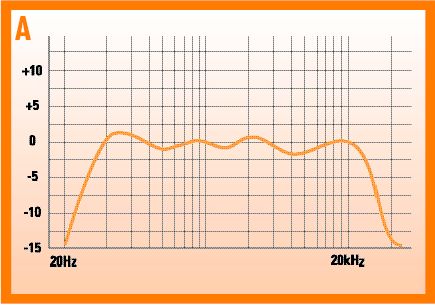
You don’t want the speaker to change the “mix” of tones; that would ruin the timbre of voices and instruments, making them sound unnatural. Ideally, you want the sounds that are on the recording to be reproduced as they were recorded, without the speaker changing the sound. To say it another way: if you made a recording of all the audible tones at the same volume and played that recording through a speaker, you’d want all the audible tones to come out at the same volume. In fact, that’s one way of measuring speakers. A signal that’s comprised of all frequencies at equal volume is fed into a speaker that sits in a room with no reflective surfaces. A calibrated microphone is placed in front of the speaker and feeds the speaker’s output into a machine that plots the frequency vs. amplitude as shown in Figure A.
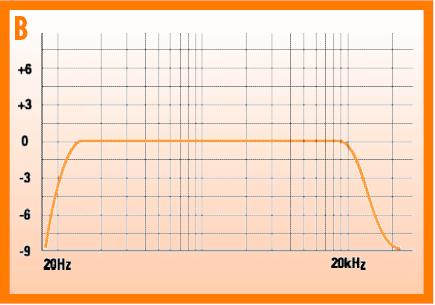
Now take a look at the graph in Figure B. That’s the frequency response of the Erehwon Model 10, with drivers and tweeters made of pure Unobtainium (“Half the carbs, all the sound!”). The flat line on the graph indicates that the speaker is “flat”; it reproduces all the musically relevant tones at the same volume. That doesn’t mean that a “flat” speaker will play all recorded sounds at the same volume — bear with me here — it means that it will treat all sounds equally; it won’t impose its will on the music but will allow you to hear the music as it was recorded. Flat is good. Flat response means that the speaker reproduces sound accurately.
Too bad that the Erehwon Model 10 doesn’t really exist, and neither does Unobtainium. Today’s technologies allow speaker designers to get closer to the “flat” ideal than ever before, but they still fall far short of “perfection.” So if a frequency range spec is not adequate, what is?
Frequency Response In Context
A big improvement would be a frequency response number that also includes the amplitude tolerance, expressed as “XHz-YkHz +/- 3dB.” This tells you that the amplitude of the speaker’s response relative to frequency does not deviate more than 3 Decibels from the center line. The “plus or minus 3dB” spec is regarded as a standard of sorts. The theory is that 3dB differences are “just perceptible,” so a speaker whose response curve lies within that tolerance window is a reasonably accurate speaker. Let’s see if that idea holds water.
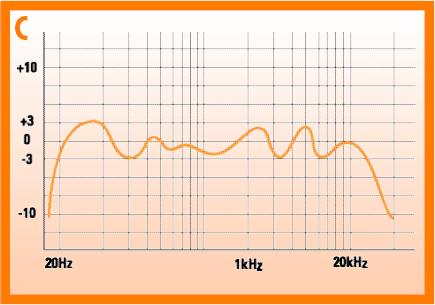
Take a look at Figure C. This speaker has response that can be specified as 20Hz-20kHz +/- 3dB. Take a look at Figure D; it, too, can have the exact same specification as Speaker C! Do you think they will sound similar? NOT! They won’t sound even remotely like one another. Speaker C will have “one note” bass and will make voices and other instruments sound unnatural, but Speaker D will sound smooth and more natural.
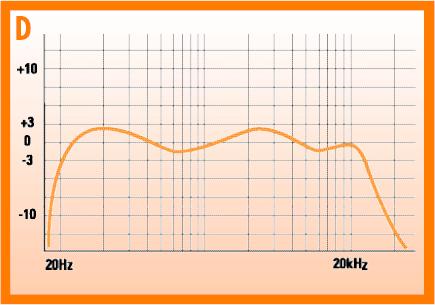
If I had to choose strictly by the response curves, I’d choose speaker D because its amplitude variations are smoother and gentler. In contrast, speaker C’s amplitude variations are more extreme and “spikey.” Experience has shown speaker designers that those rapid changes in response produce a sound that is more fatiguing, less pleasing and subjectively less accurate.
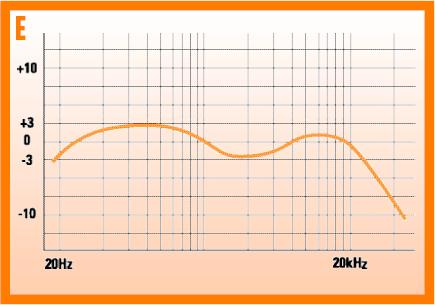
Now look at the response of the speaker in Figure E. This speaker exhibits a smooth response curve with low amplitude variations so you’d expect a fairly natural sound; however, the bandwidth of these errors is very broad, and experience has shown us that even low volume variations are audible if they cover a broad range of frequencies. In this case, Speaker E would have rich bass, prominent treble and be somewhat recessed or “laid back” in the midrange. Audiophiles call this “The Smile Curve.” It’s not the desirable trait it sounds like but it’s a very “sellable” trait to naive buyers.
My Response To Frequency
Now that you know the importance (and limitations) of amplitude variations in frequency response graphs, you might ask: “does the frequency range tell us anything at all?” Yes, it does. As long as you know the amplitude tolerance (+/- 3dB), the frequency response range or width tells you how high or low the speaker goes. A speaker rated as 20Hz – 25kHz +/- 3dB will play lower bass and higher treble sounds than a speaker that measures 40Hz – 20kHz +/- 3dB. I wouldn’t bet money that it would be the better, more enjoyable speaker, but at least I’d know something of value.
And now that you know how to interpret these numbers, you’re ready to run right out and buy a speaker just by looking at the response curve, right? I wouldn’t recommend it. Despite many advances in technology over the past 20 years, frequency response measurement is an imperfect science. The same speaker measured by two different labs may yield different response graphs. And some companies just plain cheat when they publish response curves. If it looks hand drawn, it probably was. (Yes, the graphs were hand drawn for illustration purposes.)
The Third Dimension
So far we’ve talked about frequency (the X axis of the graph) and amplitude (Y axis) but we left out an important third dimension: time. When a speaker responds to an impulse, for example a rim shot — “THWACK!” — it should start instantly and stop the instant the instrument stops making sound. If the speaker keeps vibrating or resonating and making sound after the source sound stops it’s changing, or “coloring,” the sound of the original recording. And that’s bad.
Figure F Figure G 
Figure F shows a bandwidth limited impulse signal. You can see that it starts and stops abruptly. Figure G shows that same impulse coming out of a speaker. You can see that the sound persists after the impulse input has stopped — it resonates or “rings.” The speaker is changing the timbre or character of the original recording. In order to see to what extent and at which frequencies the “ringing” is happening, we use a sophisticated computer algorithm called MLLSA (affectionately called “Melissa” by engineers who don’t date much) to measure the response of a speaker in frequency, amplitude and time. Figure H is a MLLSA spectral decay graph of a prototype speaker. The third axis of this graph is time, so graph lines closest to you are measurements taken later than the ones in the back. Think of it as a series of slices with each slice being a frequency response graph taken at a different point in time.
If we were to measure the perfect speaker the MLLSA graph would look like a straight line in back with no lines in front. Real speakers fall far short of this ideal and continue to resonate after an impulse has stopped, such as in Figure H. Figure I is a Polk LSi9, and we can see that the speaker stops responding sooner in the midrange than the speaker pictured in Figure H, indicating that the LSi9 is a better sounding speaker.
Figure H Figure I 
While no measurement technique can fully describe the subjective sound of a loudspeaker, MLLSA and other frequency response measurements are of great help to Polk engineers in developing better sounding speakers. Only a fool would design a speaker based on measurements alone and only a total fool would design a speaker based solely on subjective listening. A speaker that might sound good on a particular recording may in fact be flawed – it may have what is commonly called a “euphonic coloration.” It may be pleasing to the ear under certain conditions, but it sure ain’t right.
We use both measurements and subjective listening to design and evaluate speakers. The measurements save us time and are a great help in pointing us in the right design direction, avoiding mistakes that may come back to bite us later. The measurements give us a means of selecting which experimental designs are worth listening to.
But we have to be satisfied with the total subjective experience before a new design becomes a Polk Audio speaker. We spend countless hours listening to music and movies. Several experienced listeners have to listen to a proposed design and sign off on the sound before a model can even go into production. The Project Manager, Systems Engineer, VP of Engineering, Product Line Manager, and especially Matthew Polk, all have to agree that the prototype delivers the kind of rewarding listening experience that you expect from Polk Audio.
What’s Your Frequency?
You now know the secret: a frequency response specification is a very weak predictor of the actual performance of a loudspeaker. A frequency response chart can be more helpful, but it’s missing the important time measurement. You now know to look for overall curve smoothness and to avoid rapid swings in amplitude. Some magazines and review sites publish MLSSA graphs of reviewed speakers, and now you’ll understand how to interpret them. More power to you!
No matter how adept you might be at interpreting frequency response data, it should only be one data point among many in choosing a speaker. There is so much more to a speaker’s performance than just its response – like its dispersion and imaging, dynamic range and detail resolution as well as size, cosmetics and price. Looking at good frequency response data can help you eliminate speakers with obvious and obnoxious errors. Once you’ve eliminated the boom & tizz pseudo-fi speakers, you can settle down to careful listening and making a more informed choice.
How Polk Specifies Frequency Response
Polk Audio publishes two frequency response specifications: “Overall” and “-3dB.” “Overall” describes the frequency range limits of the speaker within an amplitude drop off of 9dB. Any frequency reproduced more than 9dB down from the rest of the frequencies will contribute little to the sound. The “-3dB” spec describes the frequency range limits of the speaker within an amplitude drop off of 3dB.
I just wrote this big article making the case that these kinds of numbers are not terribly useful in making buying decisions. So why does Polk use them? For better or for worse, these numbers are the norm in the audio industry.
To not publish them would leave an impression that our products were not competitive. A better question would be: why don’t we publish frequency response and MLSSA graphs in addition to the simple numbers? We feel that these graphs would not be meaningful to the vast majority of consumers.
It takes years of working with measurements and loudspeakers before you get a good sense of how the graphs correlate to subjective sound quality. Incorrect interpretation of graphs can easily lead to misinformation and bad choices. Finally, the variation in measurement techniques can make comparing graphs from two different labs or manufacturers unreliable and misleading.
By Paul Dicomo, Polk Audio – Marketing Manager
Originally Published: September 28, 2005
More Articles by Paul Dicomo:
All You Need to Know About Bass Management
Home Theater in a Box vs. Components. Which is Best For You?


MarkThorson1
May 9, 2012 at 12:48 am
Very enlightening, I learned more about speakers in fifteen minutes of reading then a lifetime of living. Mark
Guest
June 1, 2012 at 8:33 pm
Should there be enlarged versions of Figures F-I?
Guclaray
June 1, 2012 at 9:12 pm
Answer 2 is correct…
HRL
July 27, 2012 at 3:27 pm
Thank you for such useful info. Indeed, without such knowledge, a consumer cannot interpret intelligently the specs even on a headphone!
benji
July 28, 2012 at 11:53 pm
well said tom
derin
September 24, 2012 at 12:20 am
we hear from about 20hz-20khz
Kardel
October 10, 2013 at 12:38 am
Thank You! I have been using IEM’s for about 5yrs now, and the only thing I I ever knew about the back panel on IEM boxes was the lower the the 1st number is the stronger the bass. I’ve owned many IEMs,( 3or4 dozen) and saved receipts to take them back. It’s got to the point where sales people actually moan when I walk in the door! You’ve taught me some things I need to know, and saved me many miles of walking. Again Thank’s,
Kardel
tedtedsen
July 30, 2014 at 1:32 pm
hai will the human ear hear the difference on 118 or 127 hrz sound improwmen if you are more than 50yers old the frequecis is fading away by the age aneyway
DriftKing17
March 21, 2015 at 6:05 pm
Thanks for the info. I came here hoping to get a better grip on what to look for when looking for speakers/headphones seeing as I’m trying to get as much bang for my buck as possible and I can honestly say that I believe this did help with that. My headphones are good, great even for a $20 pair that looks exactly like at least three other pairs of headphones from three other brands, (And these perform much better than at least one of the four identical-looking differently branded sets; long story short avoid Sentry and go with Nakamichi if you have a choice and don’t ask me about iHome or iBoost because I haven’t tried those ones although the build does look pretty durable on at least the iHomes) but I’m trying to find something that can play sounds lower than the published 20Hz, and I want to be sure I’ll at least be relatively satisfied when I unbox them.
Now that I think about it I’ve never had a set of Polk Audio headphones, although there is this old pair of monitor-mounted desktop speakers I use with my MP3 player occasionally. They don’t sound half bad… I might have to sample a Polk Audio headset one of these days.
Ben in Seattle
August 23, 2022 at 2:04 am
This is an old article, but a classic and still extremely valuable. Thank you ecoustics for keeping it available.
One question I have is: Why did the industry settle on ±3dB for frequency response? The engineers surely knew about RMSE (root-mean-square error), which would have been just as succinct of a spec, but gives much more valuable information by eliminating the lousy speakers represented by figure C. Was it that calculating RMS was tricky before the advent of cheap digital meters?