Latest Posts
|
Hi-Fi
|
Loudspeakers
|
Home Theater
|
Headphones
|
Music
|
Podcasts
Forum Search
Home
>
Forum
>
Car Audio Forum
>
Car Subwoofers Forum
>
Archive through May 03, 2006 Forum
>
Can someone double check this for me
bassfishing
Silver Member
Username: Langless28
Boston, MA
Post Number: 547
Registered: Dec-04
Posted on
Tuesday, May 02, 2006 - 22:36 GMT
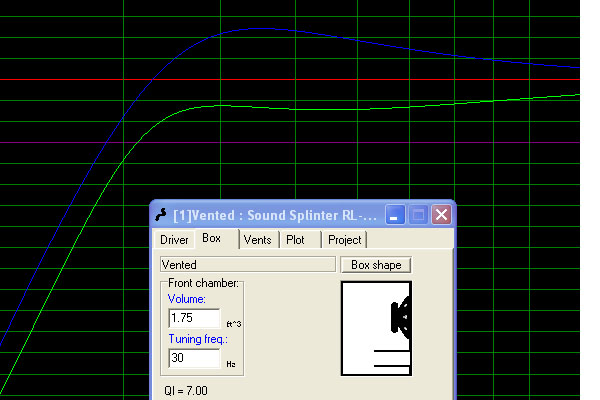
the green plot is the rl-p and the blue is the tsx. whats with the dip in the rl-p plot? is that going to effect sq. also, why does the rl-p plot also entirely below the 0db mark and the -3db mark occurs at like 35 hz?
« Previous Thread
Next Thread »
Main Forums
Today's Posts
Home Audio Forum
Home Video Forum
Home Theater Forum
Car Audio Forum
Car Accessories Forum
Car Amplifiers Forum
Car Disc Changers Forum
Car EQ & Crossovers Forum
Car Multimedia Forum
Car Radio Codes Forum
Car Security Systems Forum
Car Speakers Forum
Car Subwoofers Forum
GPS Navigation Systems Forum
Head Units Forum
Radar Detectors Forum
Accessories Forum
All Forum Topics
Forum Help
Forgot Password
Logout
Register
Rules
Shortcodes
Troubleshooting
Announcements
Your Account
Follow Us
Facebook
Instagram
LinkedIn
Twitter @ecoustics